The "Fingerprint" of Feedlots
New study identifies chemical emissions markers for feedlot operations
Gathering accurate, big-picture information on emissions from concentrated animal feedlot operations (CAFOs) is no easy task. If you live anywhere near a feedlot, you can imagine the challenge: some days it smells strongly; others, not at all. It's not just the wind that makes the difference, it's operations on those feedlots, which can vary greatly. But a new study out of NOAA in Boulder, which involved chemically "sniffing" the air downwind with sophisticated instruments, finds surprising similarities in the airborne emissions from feedlots. Their work promises to help scientists assess the effect of feedlots on air quality, as well as distinguish feedlot emissions from other sources. It can also help livestock owners identify which practices are most environmentally friendly.
“Feed, manure handling, composting, waste lagoons—all these practices affect the emissions,” says Scott Eilerman, a CIRES researcher in NOAA’s Earth System Research Laboratories, and lead author on the study. “In the past, what we’ve done is take snapshot measurements—short-term projects that last from hours up to weeks.” That provides researchers with lots of little measurements that give excellent small-scale detail. Alternatively, there have also been longer term measurements, taken while staying at a single spot over the course of a year. But those are also limited to a particular place.
“We wanted to bridge the gap between those two,” explains Eilerman. So for a over a year, once every season, he and his colleagues piled into a mobile lab—a big van with a bunch of chemical and meteorological instruments installed in it—and motored around Weld County, Colorado. Using public roads, they drove near beef, dairy and sheep farms; they took turns driving for 24 hours straight, taking constant measurements day and night.
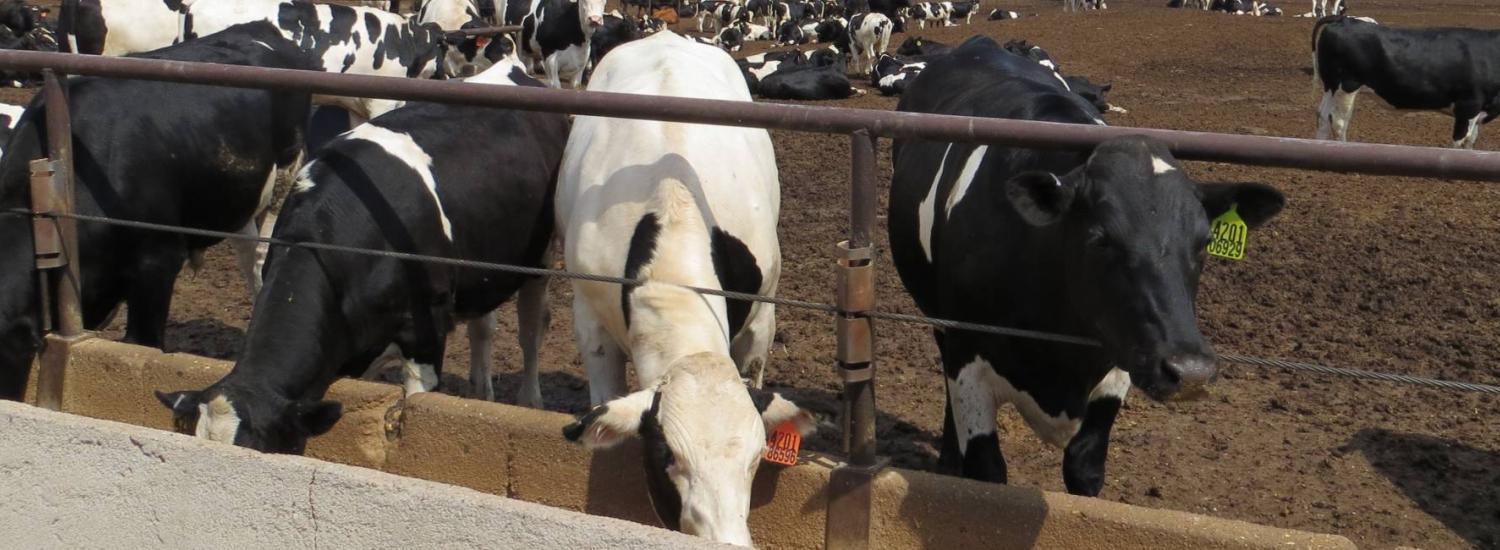
![]() The NOAA van, outfitted with instruments to take measurements of methane, nitrous oxide and ammonia. Credit: J. Peischl
The NOAA van, outfitted with instruments to take measurements of methane, nitrous oxide and ammonia. Credit: J. Peischl
These new, detailed measurements showed, surprisingly, that there were consistent patterns of emissions downwind. “We developed a good picture of the daytime and nighttime emissions, which were consistent between all feedlots and between seasons,” says Eilerman. To be clear they weren’t measuring the amount of emissions; rather, they wanted to understand the ratios of one gas to another, for example, how much ammonia relative to methane and relative to nitrous oxide. Such ratios constitute a chemical "fingerprint," and this NOAA-led research team has used a similar technique to study the airborne impact of natural gas operations in northern Colorado and elsewhere.
Their results show that there is something of a "fingerprint" for CAFOs—a certain pattern to their emissions. That's critical, as it can help scientists attribute emissions to specific sources. “Lots of measurements at NOAA are aircraft campaigns,” says Eilerman. “Let’s say you’re looking at methane and you want to look at emissions from oil and gas development. If you’re picking up methane but it also has traces of ammonia, it means it’s probably coming from feedlots, not oil and gas. This fingerprint really helps with source attribution.”