How Bad is the Smoke? Current Fires and Air Quality Resources
Top 10 ways to get up-to-date information on fires and air quality
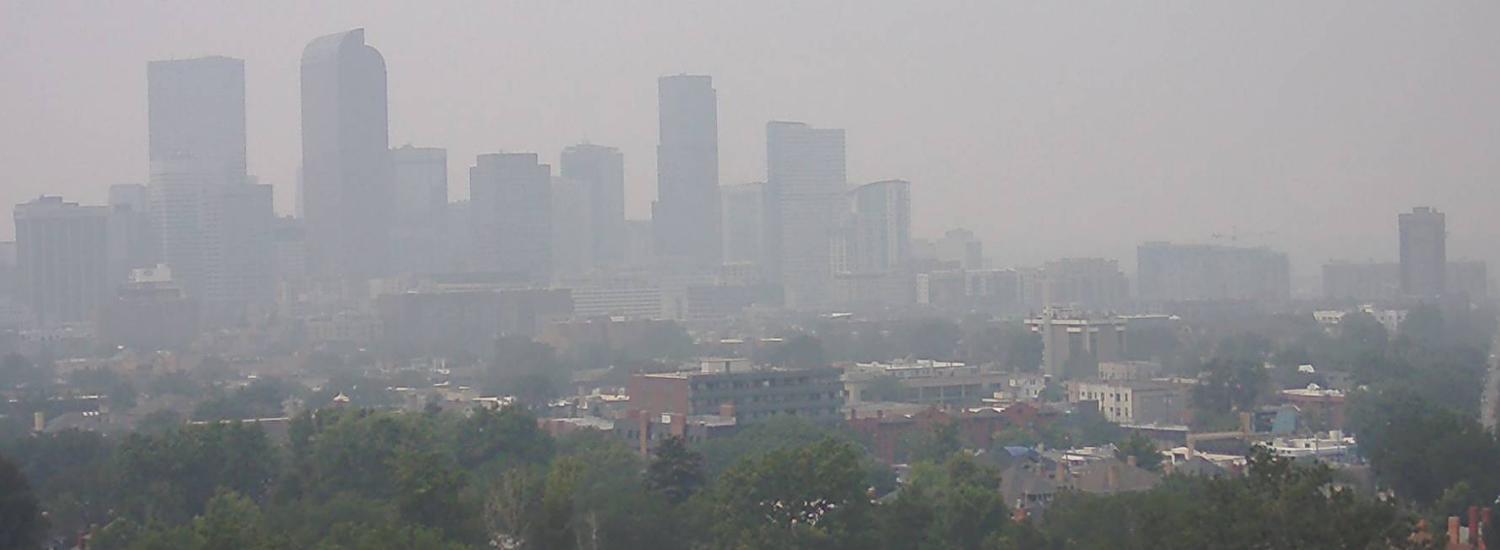
Every year, tens of thousands of wildfires burn millions of acres in the United States, blanketing one community after another in smoke. CIRES' team of fire experts at CU Boulder have compiled a list of go-to resources that provide up-to-date information on how the wildfires are progressing, the smoke transport in the atmosphere, and impacts to air quality.
These efforts draw on many different sources of information—from local air quality monitoring stations to satellites in space. They represent how big data, and the hundreds of scientists behind those data, are helping us understand fire. Always check with your local emergency department for specific information on evacuations and immediate threats to lives and property.
Jump to sections below: Fires, Smoke & Wind, Air Quality, My State
What’s burning in the United States?
Check out this interactive map from the National Interagency Fire Center (NIFC). This visualization platform provides fire incident data, including satellite-based detections from MODIS and VIIRS, active fire perimeters, NowCoast radar, and fire weather. You can download data in KML format (for viewing in Google Earth) here. You can also read the daily aggregation of incident reports here, which provides a brief national summary of the fires that are burning and news related to these fires, a weather forecast, and daily summary statistics on the number of large and active fires, area burned, and percent contained by state.
Want to know more about specific fires and what they are doing?
Use the InciWeb Incident Information System. By looking at the map of the United States, you can click on fires of interest to get more information about the size and percent contained, often updated more than once a day for the significant events.
What does the smoke look like in my state?
Check out the smoke forecast from NOAA-HRRR. This is a visualization of a prediction of the movement of smoke in three dimensions across the country over 48 hours, simulating how the weather will impact smoke movement and how smoke will affect visibility, temperature, and wind. Or you can zoom into your area with this global visualization from the Regional and Mesoscale Meteorology Branch of CIRA, the Cooperative Institute for Research in the Atmosphere.
Do you want to see both fires and smoke?
ESRI’s USA Wildfires story map allows you to interactively explore active wildfires and smoke forecasts across the United States. Fire locations and perimeters are updated every 15 minutes from Integrated Reporting of Wildland-Fire Information (IRWIN) and the National Interagency Fire Center (NIFC). Smoke forecasts from the National Weather Service also show a 48-hour forecast window in 1-hour increments. Or check out NOAA’s Hazard Mapping System Fire and Smoke Product. This site provides the locations of satellite fire detections and smoke observed from space. These observed smoke estimates are typically drawn in the afternoons. And it is important to note, just because smoke is drawn does not mean that it is necessarily reaching the ground.
Want to see all kinds of aerosols (i.e., minute particles in the atmosphere)?
Check out AerosolWatch, which provides national and global maps of clouds, smoke, dust, aerosol concentrations, and more, updated every 10 minutes using data collected by the GEOS and VIIRS satellites.
Want to know what the wind is doing in your area? Or across the globe?
Windfinder provides current wind speed, wind direction, air temperature, air pressure and tide forecasts from a global network of over 45,000 locations worldwide. Windfinder also provides an archive of wind data going back to 1999. Or check out EarthWindMap—a global map of supercomputer-forecasted wind strength and direction updated every three hours. This tool includes the option to overlay the concentrations of particulate matter that are harmful to humans (like PM2.5 that can be found in wildfire smoke) as detected by Earth observing satellites.
How bad is the air near me?
Check out Smoke Sense. This app, developed by the Environmental Protection Agency, gives real-time air quality data on particulate matter and ozone, based on your location. It ties your location to the nearest monitoring station around the country. Similar information is also provided by AirNow. For just exploring particulate air pollution, check out the PurpleAir sensor map or openaq, an open source air quality data network.
Is the air good enough to go for a walk in my neighborhood?
BreezoMeter is an app that indicates how far you are from active fires and the air quality and pollen forecast at the street level. The Breezometer global Air Quality Index or AQI (BAQI) considers all six major air pollutants (ground level ozone, sulfur dioxide, carbon monoxide, nitrogen dioxide, fine particulate matter and inhalable particle pollution) to provide a globally comparable air quality metric on your street.
What does air pollution look like around the planet?
Visit the World Air Quality Information site. This effort provides real time air quality at 30,000 stations worldwide, with ratings ranging from good to hazardous. In addition to current air quality, this site also provides air quality information for the past 12 months around a particular station.
What are the air quality issues in the Western United States?
The Western Regional Air Partnership (WRAP) is a voluntary partnership between states, tribes, federal land managers, local air agencies and the United States Environmental Protection Agency to understand regional air quality issues in the West. WRAP develops, maintains, and shares data and results from various information sources to produce consistent, comparable, and complete results for use by member jurisdictions and agencies.
Often individual states will provide their own wildfire, smoke, and air quality information. For example:
Alaska: Alaska Interagency Coordination Center
Arizona: Arizona Smoke Forecast
California: California Smoke Blog
Colorado: Department of Public Health air quality monitoring sites
Idaho: Idaho Smoke Blog
Montana: Montana Smoke Report
New Mexico: Air Quality Bureau
Oregon: Lane Air
Washington: Washington Smoke