Unprecedented Ice Loss in Russian Ice Cap
New CU Boulder-led study shows just how quickly cold glaciers can change speed, lose mass
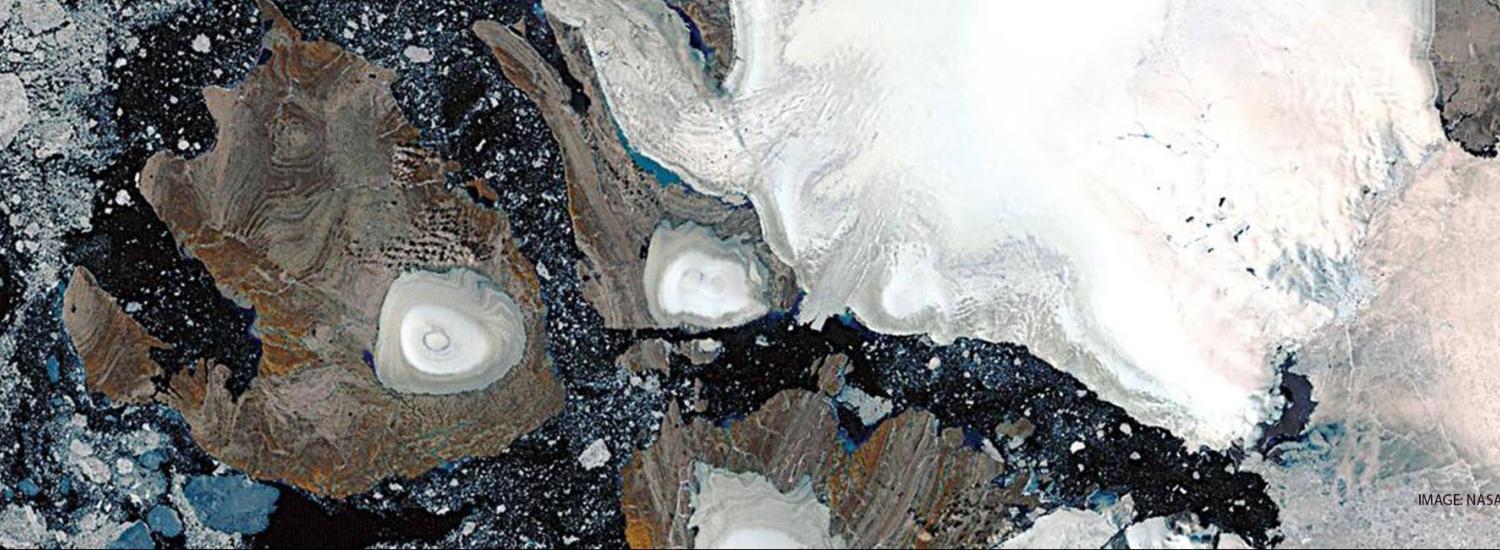
In the last few years, the Vavilov Ice Cap in the Russian High Arctic has dramatically accelerated, sliding as much as 82 feet a day in 2015, according to a new multi-national, multi-institute study led by CIRES Fellow Mike Willis, an assistant professor of Geology at CU Boulder. That dwarfs the ice's previous average speed of about 2 inches per day and has challenged scientists' assumptions about the stability of the cold ice caps dotting Earth's high latitudes.
“In a warming climate, glacier acceleration is becoming more and more common, but the rate of ice loss at Vavilov is extreme and unexpected,” said Mike Willis, CIRES Fellow and lead author of the paper published this week in Earth and Planetary Science Letters.
Video compiled by Whyjay Zheng/COrnell University using LANDSAt imagery by NASA/USGS.
Glaciers and ice caps like Vavilov cover nearly 300,000 square miles of Earth’s surface and hold about a foot of potential sea-level rise. Scientists have never seen such acceleration in this kind of ice cap before, and the authors of the new paper wrote that their finding raises the possibility that other, currently stable ice caps may be more vulnerable than expected.
For the new assessment, researchers played the part of forensic ice detectives, piecing together the ice cap’s deterioration by spying on the advancing ice with remote sensing technology from a constellation of satellites operated by DigitalGlobe Inc, headquartered in Westminster, Colorado.The project also relied on support from the National Science Foundation and the National Geospatial-Intelligence Agency, which funded the development of high-resolution topographic maps of the Arctic.
By satellite, they watched ice on the cap creep slowly forward for several years, before it accelerate slowly in 2010, surging rapidly forward in 2015. The initial very slow advance is thought to have been caused by a shift in the direction of precipitation that occurred about 500 years ago. Before this time snow and rain came from the southeast, after this time rain and snow came from the southwest. As the western part of the ice cap advanced into the ocean the ice surged forward.
“Cold” ice caps, like Vavilov, occur in polar “deserts” with very little precipitation, and they’re normally frozen to their beds, flowing only due to bending of the ice under the force of gravity. With beds above sea level, they are normally insulated from the kinds of changes that have hit glaciers in less frigid regions: melting from below by warm sea water, for example, or sliding faster when warm surface meltwater drains to the bed of the ice.
Researchers suspect the ice cap began to dramatically advance when the bottom of the ice cap became wetter and the front of the glacier advanced onto very slippery marine sediments. The ice began to speed up, and friction caused some of the ice underneath the glacier to melt, which supplied more water to the bottom of the ice, reducing friction, which caused the ice to speed up, which in turn, again produced more water. Some of this water might have combined with clay underneath the glacier, reducing the friction beneath the glacier even further and allowing the truly extraordinary sliding speeds to occur.
By 2015, the sediments and rock at the bed beneath the ice had become so slippery that the material couldn’t stop the ice from flowing. It took just two years for the ice cap base to reach that tipping point, transforming into a near frictionless zone, which is well-lubricated and highly mobile. The glacier continues to slide today at accelerated speeds of 5-10 meters per day.
The Vavilov Ice Cap thinned by a total of a few meters, advanced about 2 km, and lost about 1.2 km3 in total volume into the ocean in the 30 years before the speedup. In the one year between 2015 and 2016, the ice advanced about 4 kilometers and thinned by about 100 meters (~0.3 m per day). The ice cap lost about 4.5 km3 of ice, enough to cover Manhattan with about 250 feet of water, or the entire state of Washington with an inch. And it’s unlikely the ice cap will ever be able to recover ice mass in today’s warming climate, the paper states.
Many scientists have assumed that polar ice caps that sit above sea level will only respond slowly to a warming climate—but the authors of this study urge that this assumption be questioned. The rapid collapse of the Vavilov Ice Cap has significant ramifications for glaciers in other polar regions, especially those fringing Antarctica and Greenland.
“We’ve never seen anything like this before, this study has raised as many questions as it has answered.” said Willis. “And we’re now working on modeling the whole situation to get a better handle of the physics involved.”
Timeline of Events
1952-1985: Western region of the Vavilov Ice Cap in Russia advances about 400 meters (~12 m per year.)
1996: The fastest ice on the ice cap moves about 20 meters per year, (5 cm a day).
1998-2011: Rate of ice advance increased significantly to about 75 m per year.
2010: The ice in the western region of the ice cap begins to accelerate more dramatically.
2011: Scientists observed crevasses in the ice cap, signalling further acceleration.
2013: The glacier spreads out into the ocean and starts to speed up to about 2 or 3 meters per day. Not much thinning is seen inland.
2014: The ice continues to push in to the ocean and speeds up to about 6 meters per day by the end of the summer. Not much thinning is seen inland.
2015: The glacier reaches a top speed of about 25 meters per day (~9125 m per year) and a wave of thinning starts to move inland.
2015-2016: The ice cap advances more than 4000 m in 12 months, sustains extraordinary speeds and thinning of more than 100 meters migrates inland.
2017: While slower than 2015 and 2016, Vavilov continues to slide at accelerated speeds of a few meters per day.
This work was partly supported by NASA, the Ministry of Education, Taiwan, Polar Geospatial Center at the University of Minnesota (www.arcticdem.org), NSF, and UK National Environment Research Council. In 2015, The National Science Foundation announced it was working with the National Geospatial-Intelligence Agency to support the development of high-resolution topographic maps of the Arctic to provide the first consistent coverage of the entire globally significant region, including Alaska. In 2016, NSF and NGA publicly released the Alaska maps in support of a White House Arctic initiative to inform better decision-making in the Arctic.