Multipurpose Mapping
NOAA-based team makes 3-D coastal models for underwater navigation, emergency management, science exhibits, and more
Say you're developing a training program for submarine pilots. You want an underwater scene that's realistic so that their training is meaningful. NOAA's got those data, thanks to a team of CIRES and federal employees ironically located in the landlocked state of Colorado. These scientists, working as part of NOAA’s National Centers for Environmental Information (NCEI), develop high-resolution, three-dimensional coastal maps, or digital elevation models (DEMs).
NCEI’s DEMs pages receive tens of thousands of visits per month; users include academics, fisheries managers, consultants and more. A team of consultants from Booz Allen Hamilton, for example, used coastal DEMs for San Diego to develop an underwater visualization tool for submarine pilots. Education specialists from the International Ocean Discovery Program incorporated some of the team’s work—a high-resolution topography map of the world’s ocean floors—into a large-scale traveling exhibit about the science of ocean drilling. And emergency managers rely on accurate, up-to-date DEMs to model storm surges and plan for powerful storms.
“Our models help people plan, prepare for, and better understand ocean processes,” said Matt Lancaster, a digital elevations model developer and CIRES scientist at the University of Colorado Boulder working in NCEI. “They have a wide range of scientific and technical uses, including tsunami and storm-surge forecasting and warning, hazard mitigation and community preparedness, ecosystem management and habitat research,” he said.
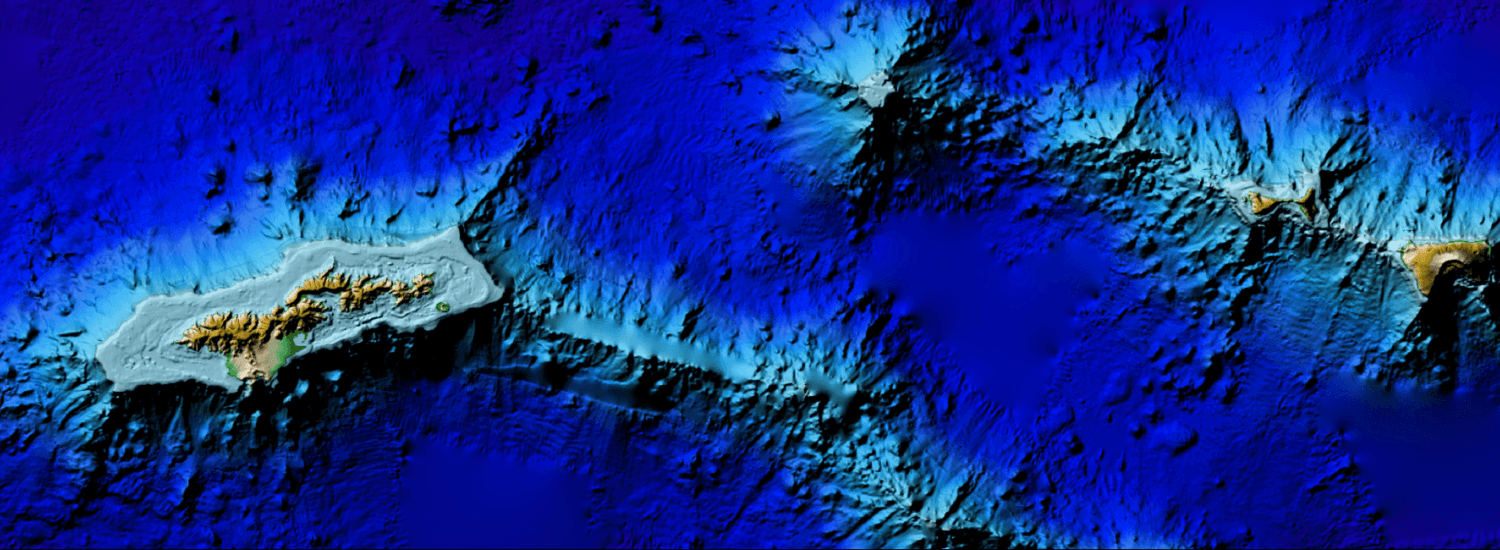
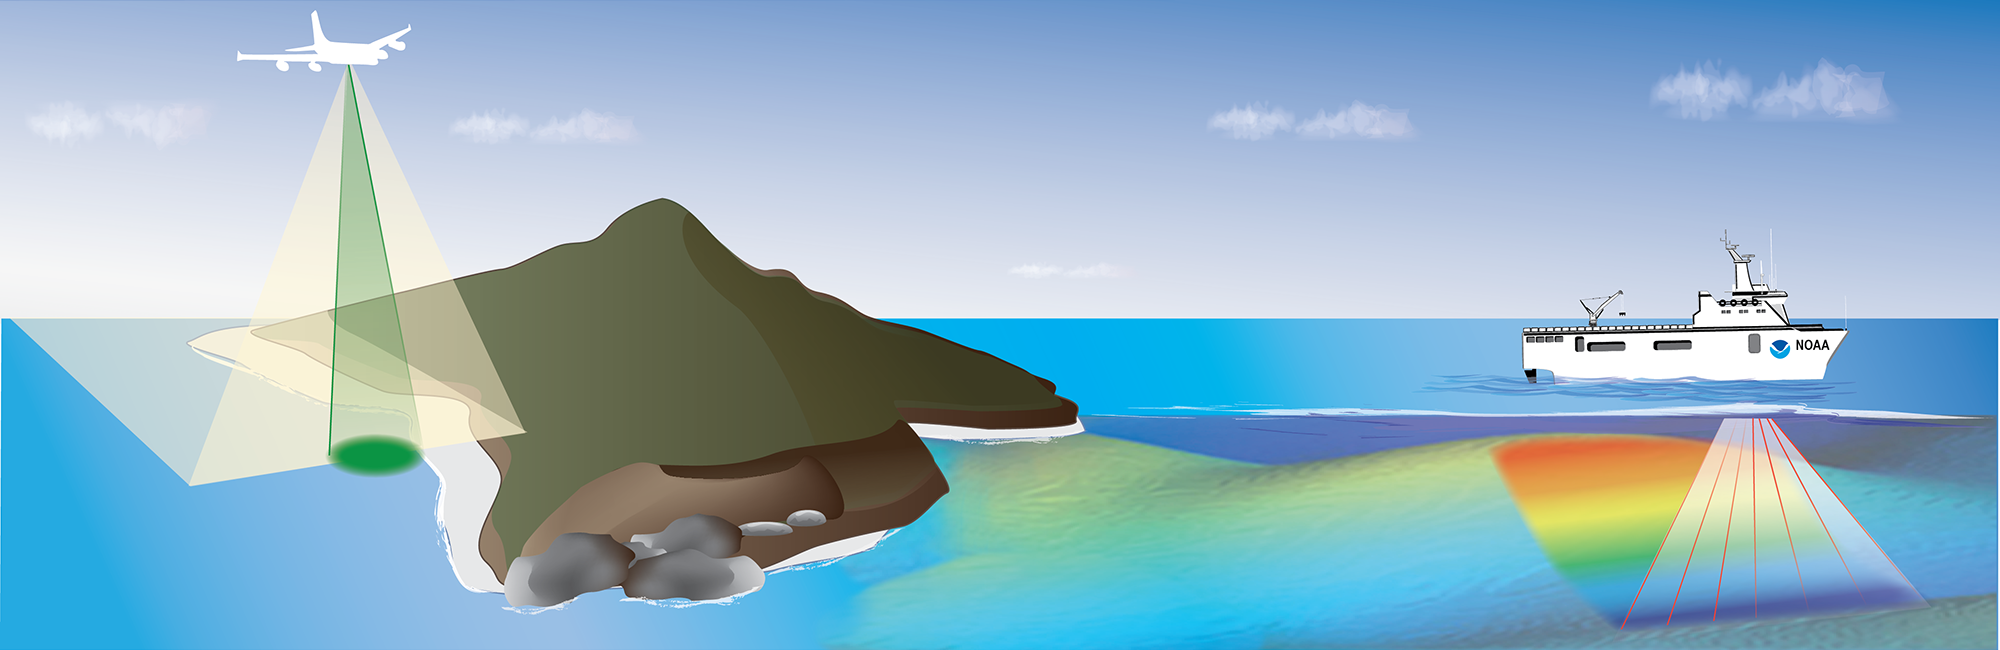
Scientists need accurate measurements of both land topography and seafloor topography (bathymetry) to make digital elevation models. To calculate elevations on land and in shallow water, the tool of choice is often lidar, or light detection and ranging. Lidar can be deployed on land or from aircraft and even satellite. To map out surface features on the seafloor under deeper water, scientists use technologies such as ship-mounted, multibeam swath sonar.
To build precise coastal DEMS, the NCEI team uses other data, too, including single beam/trackline sonar, hydrographic surveys, and satellite-derived topography. These data come from various NOAA offices and other government agencies, academic and nonprofit institutions, and private companies. NCEI manages and archives a majority of these datasets.
One characteristic of some of the digital elevation models this team builds is that their resolution changes: along the shore, where data tend to be more dense, models may capture features as small as 3 m. That's enough to map out the small tidal creeks dissecting a salt marsh. Farther offshore, where ocean depths increase, sparser measurements mean those parts of the models are lower-resolution.
Submarine Training
Submarine pilots today typically navigate three-dimensional underwater environments with two-dimensional charts and sonar. A team at Booz Allen Hamilton has set out to change that with a project called OceanLens TM. “Our goal was to take bathymetric data and create a visualization tool to turn that data into a 3-D virtual rendering of the world’s oceans,” said Booz Allen Hamilton’s Rachel Dendiu, project manager.
![]() OceanLens TM incorporates bathymetric data into an interactive 3-D environment, allowing users to explore the undersea domain in virtual reality. Image: Booz Allen Hamilton
OceanLens TM incorporates bathymetric data into an interactive 3-D environment, allowing users to explore the undersea domain in virtual reality. Image: Booz Allen Hamilton
In a prototype version of OceanLens TM, designed for a defense-related client, users strap on a virtual reality headset and navigate a 3-D underwater tour of the San Diego coast—an experience created in part with NCEI’s San Diego DEMs and bathymetric data.
“We can use this tool for mission planning, navigation, and training,” said Dendiu. “Also, we can overlay other datasets onto the bathymetric data—for example, water temperature, salinity, weather, and other information submariners care about. So it’s a huge improvement to have a 3-D rendering of the ocean.”
Her group is developing 3-D datasets for other locations around the world, relying on bathymetric data and DEMs from NCEI and other sources. Although OceanLens TM is specifically for the defense industry, Dendiu said, other potential users include the oil and gas industry and operators of unmanned underwater vehicles.
Pop-up Science Events
The International Ocean Discovery Program (IODP) needs NCEI data for another reason: Education. IODP advances understanding of the Earth through scientific drilling, coring, and monitoring of the subseafloor, through several scientific expeditions each year on its flagship vessel, the JOIDES Resolution, and other platforms. The international program involving two dozen countries produces great science, but it has a bit of a public relations challenge. “We have an amazing ocean drilling program, going on for nearly 50 years, but most people in this country have never heard of it,” said Sharon Katz Cooper, education and outreach manager for the IDOP’s U.S. Science Support Program.
The JOIDES Resolution is rarely in a U.S. port for any long stretch of time, making it difficult for Cooper and her colleagues to bring people to the ship. Instead, they’ve figured out a way to bring the ship and IODP on the road—as a large-scale traveling exhibit. In addition to an inflatable version of the ship, with a video installation and several interactive kiosks, there’s a 30’ by 20’ floor map of the world’s oceans.
![]() In Search of Earth’s Secrets is a 5-year project designed to create “pop-up” science events in the style of pop-up restaurants, stores, and art fairs. The exhibit features a giant floor map that uses NCEI’s ETOPO1 Global Relief Model of Earth's surface integrating land topography and ocean bathymetry. Image: The International Ocean Discovery Program
In Search of Earth’s Secrets is a 5-year project designed to create “pop-up” science events in the style of pop-up restaurants, stores, and art fairs. The exhibit features a giant floor map that uses NCEI’s ETOPO1 Global Relief Model of Earth's surface integrating land topography and ocean bathymetry. Image: The International Ocean Discovery Program
“We’re using a global bathymetry map that has all the geographical features,” said Cooper. “It was important for us to be able to show the size and scale of the ocean and teach visitors that the ocean floor is not flat. It was a bit of a challenge to find a model that was both high enough resolution and scientifically correct. NCEI provided that.” NCEI is also the archive for data and information collected by IODP.
The exhibit, In Search of Earth’s Secrets, will soon travel the country as part of a National Science Foundation-funded project. “Our goal is to go to places with rural and under-served populations that don’t have access to world-class museums, to pull in folks who might not discover this science otherwise,” said Cooper. The exhibit will run through 2021, with some locations still to be determined.
Remapping the New Jersey Coast
Hurricane Sandy made landfall along the U.S. East Coast in 2012, altering the shoreline and the seafloor with its strong winds and waves. After the storm, existing coastal elevation models for the region were no longer accurate. Even small changes on the seafloor and shoreline can change where sea water may surge in and where flood water may flow during big storms, so precise, up-to-date models are critical.
Backed by federal funding allocated to areas affected by the hurricane, the NCEI team updated models of the New Jersey coast, above and below the waterline. These new coastal DEMs help coastal planners, emergency managers, and communities better prepare for storm surges, flooding, and property damage when big storms hit.
![]() Draft image of the combined DEM tiles, merging bathymetry and topography, for the New Jersey coast and Delaware Bay. Credit: NOAA NCEI
Draft image of the combined DEM tiles, merging bathymetry and topography, for the New Jersey coast and Delaware Bay. Credit: NOAA NCEI
Similar efforts to map coastlines in Florida and the Houston area are underway and are part of a larger effort by the NCEI team to create digital elevation models for coastal regions throughout the United States and its territories, plus some international locations.
“The high-resolution coastal digital elevation models built by the team at NCEI carefully integrate on-land topography with off-shore bathymetry to provide an invaluable view of our coastal zone that is needed for modelers to predict how a tsunami or storm surge will affect our coastal communities,” said Kelly Stroker, Chief of the Coastal and Marine Geophysics Section at NOAA NCEI in Boulder, Colorado.
More information on the team and their methods here, and coastal DEMS and data here.