Since the early 2000s, the Greenland Ice Sheet’s mass balance has been consistently negative, meaning more mass is being lost than gained. But this change in mass balance hasn’t always happened at the same rate. What could account for observed changes to the amount of ice in the Greenland Ice Sheet in recent decades?
Context for Use
This Data Puzzle is part of a larger collection of Data Puzzle resources that combine classroom-friendly datasets with Ambitious Science Teaching practices to help students make sense of phenomena!
- Note that this resource is in the process of being classroom tested and is therefore in a draft form.
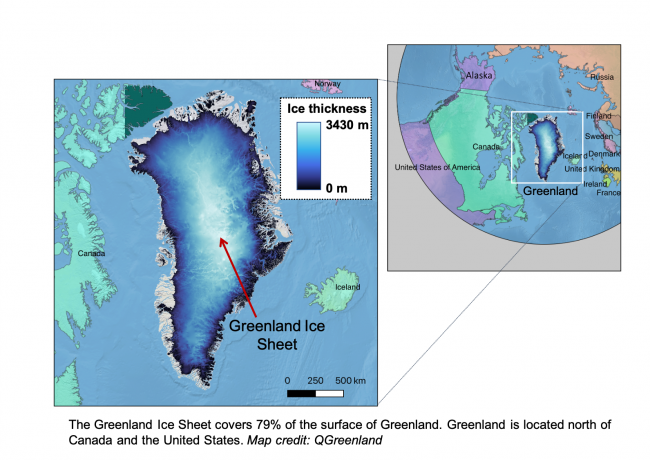
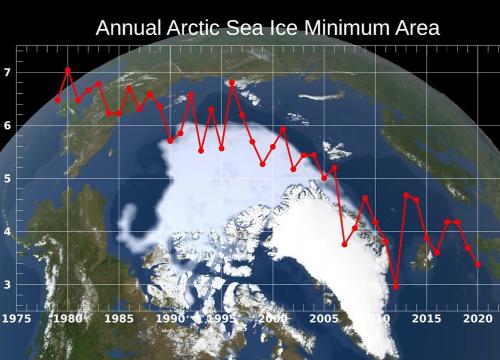
Image from QGreenland project.


Goals Header
What Students Will Do
- Analyze and interpret Greenland Ice Sheet mass balance and climatic data to evaluate how and why the Greenland Ice Sheet’s mass balance changes over time.
- Construct conceptual models to explain the primary factors controlling the stability and change of the Greenland Ice Sheet’s mass balance from 2000-2018.
Teaching Materials
Description
Part 1 (10 minutes) Eliciting Students' Ideas
- Students engage in a "think-pair-share" discussion activity related to the opening scenario prompt, "Think back to a time when you had a delicious ice cream cone with your favorite flavor (mmm...cookie dough). What controls how much ice cream you have, whether it stays frozen or melts, or even how fast it melts?" Teacher will use student ideas and information from the slide deck to make connections to the featured scientists work studying the growth and melt of the Greenland Ice Sheet.
Part 2 (40 minutes) Identifying Important Science Ideas
- Students engage with an interactive reading to 1) identify similarities between the opening scenario prompt and the work for Dr. Ruth Mottram, a climate scientist who studies the factors that cause ice sheets to grow and shrink; and 2) make predictions as it relates to the investigative question, "What factors are contributing to changes to the Greenland Ice Sheet in recent decades?"
Part 3 (40 minutes) Supporting Ongoing Changes in Thinking
- Students test/compare their current understandings of the featured scientist’s research against authentic data.
Part 4 (30 minutes) Constructing Evidence-Based Explanations
- Students reflect on evidence gathered in parts 1-3 to construct a final explanatory model for the investigative question, "What factors are contributing to changes to the Greenland Ice Sheet in recent decades?"