Dr. Walt Meier presents on Sea Ice (What it is and why we study it)
Goals Header
About the Presenter
Dr. Walt Meier is an expert in sea ice with the National Snow and Ice Data Center (NSIDC). His research focuses on studying the changing sea ice cover using satellite sensors and investigation of impacts of the declining Arctic sea ice on climate and people. In addition to his time at NSIDC, Walt has also been a research scientist for the NASA Goddard Space Flight Center Cryospheric Sciences Lab, an adjunct assistant professor at the U.S. Naval Academy, and a visiting scientist at the U.S. National Ice Center. Walt is passionate about science education and outreach and is a highly sought after expert for interviews in the media.
Recommended Activities for e-Learning
Elementary:
This activity from JPL uses heat lamps and ice to show how sea ice and land ice impact sea level rise. No heat lamp at home? You can use the sun or another heat source to gently melt the ice. The Lunar and Planetary Institute offers a very similar activity here.
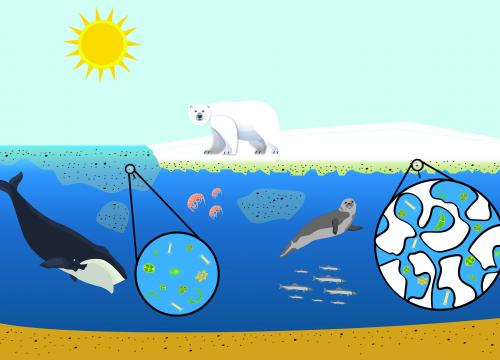
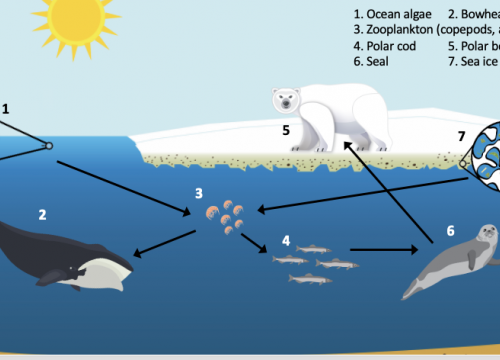
This audio slideshow produced by WHOI, examines the changes in the ecosystem that will occur to the Arctic due to increasing temperatures and disappearing sea ice.
Middle/Secondary:
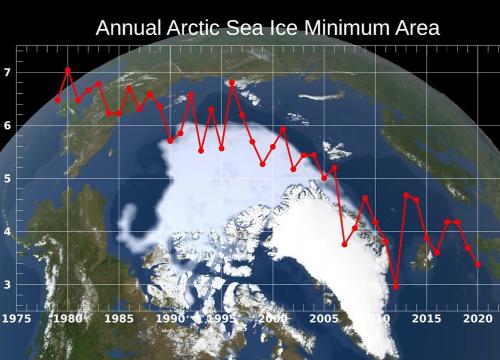
The NSIDC Sea Ice Index--Sea Ice Animation Tool uses research collected by Dr. Meier to demonstrate the sea ice extent from 1978 to present.
This video explains the technology used to monitor sea ice.
In this activity students use NASA satellite data to study changes in temperature and snow-ice coverage in the South Beaufort Sea, Alaska. They will then correlate the data with USGS ground tracking of polar bears and relate their findings to global change, sea ice changes, and polar bear migration and survival.
High School:
Use real datasets to investigate the melting arctic sea ice in this activity. The activity is framed around a case study which has students working side-by-side with a scientist from the National Snow and Ice Data Center and an Inuit community in Manitoba.
This lesson from UCAR's Windows to the Universe has students graph real data for the sea ice extent in both polar regions (Arctic and Antarctic). They start out by forming a hypothesis on the variability of sea ice, testing the hypothesis by graphing real data from a recent 3-year period to learn about seasonal variations and over a 25-year period to learn about longer-term trends, and finish with a discussion of their results and predictions.
All ages:
This short visual shows the sea ice extent from 1979-2016.