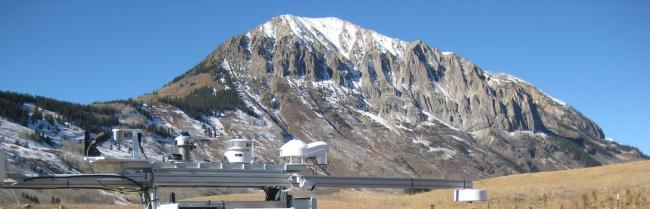
Snow is the most abundant and precious form of water in the Rocky Mountains with tens of feet of snow falling each winter. When temperatures rise each spring, the water from snowmelt high up in the Rockies ultimately makes its way down into the Colorado River, a water source upon which 40+ million people in 7 southwest states depend. Because so many people rely on the water from snowmelt high in the Rockies, it’s important to be able to predict not only how much water (in the form of snow) there is each year but also when this water will become available (through snowmelt) to downstream users. Scientists working on a project called the Study of Precipitation, the Lower Atmosphere and Surface for Hydrometeorology (SPLASH), are trying to improve our understanding of how water moves through Rocky Mountain watersheds by focusing on the East River Watershed.

Goals Header
What Students Will Do
- Analyze and interpret snow data to evaluate the changing conditions in Colorado’s East River Watershed.
- Construct conceptual models to explain how snow conditions have changed in the East River Watershed.
Teaching Materials
Description
Part 1 – (20 minutes) Eliciting Students’ Ideas
- Access students' prior knowledge by asking students to consider the snowiest winter they've ever experienced, and factors that might cause some winters to be snowier than others.
Part 2 – (80 minutes) Identifying Important Science Ideas
- Students engage with an interactive reading to 1) making connections between the opening scenario prompt and the work of Dr. Janet Intrieri, an atmospheric scientist studying changing hydrological conditions in Colorado's East River Watershed, 2) make predictions as it relates to the investigative question, "How have snow conditions (total snowfall and timing of snowmelt) in the East River Watershed changed over time?", and 3) visiting field sites in this virtual reality tour!
Part 3 – (40 minutes) Supporting Ongoing Changes in Thinking
- Students test their predictions by analyzing total snowfall and timing of snowmelt datasets from the Rocky Mountain Biological Lab in Colorado's East River Watershed.
Part 4 – (40 minutes) Constructing Evidence-Based Explanations
- Students reflect on evidence gathered during parts 1-3 and construct a final explanatory model for the question, "How have snow conditions (total snowfall and the timing of snowmelt) in the East River Watershed changed over time?"