Despite pandemic shutdowns, carbon dioxide and methane surged in 2020
Economic slowdown prevented a record increase in carbon dioxide
Levels of the two most important anthropogenic greenhouse gases, carbon dioxide and methane, continued their unrelenting rise in 2020 despite the economic slowdown caused by the coronavirus pandemic response, NOAA announced today.
The economic recession was estimated to have reduced carbon emissions by about 7 percent during 2020. Without the slowdown, the 2020 increase would have been the highest on record, according to Pieter Tans, senior scientist at NOAA’s Global Monitoring Laboratory. Since 2000, the global carbon dioxide (CO2) average has grown by 43.5 ppm, an increase of 12 percent.
The global surface average for CO2, calculated from measurements collected at NOAA’s remote sampling locations, was 412.5 parts per million (ppm) in 2020, rising by 2.6 ppm during the year. The global rate of increase was the fifth-highest in NOAA’s 63-year record, following 1987, 1998, 2015 and 2016. The annual mean at NOAA's Mauna Loa Observatory in Hawaii was 414.4 ppm during 2020.
The atmospheric burden of CO2 is now comparable to where it was during the early Pliocene epoch, between 4 and 5.3 million years ago. During that time sea level was about 78 feet higher than today, the average temperature was 7 degrees Fahrenheit higher than in pre-industrial times, and studies indicate large forests occupied areas of the Arctic that are now tundra.
“Human activity is driving climate change,” said Colm Sweeney, deputy director of the Global Monitoring Laboratory (GML). “If we want to mitigate the worst impacts, it’s going to take a deliberate focus on reducing fossil fuels emissions to near zero - and even then we’ll need to look for ways to further remove greenhouse gasses from the atmosphere.”
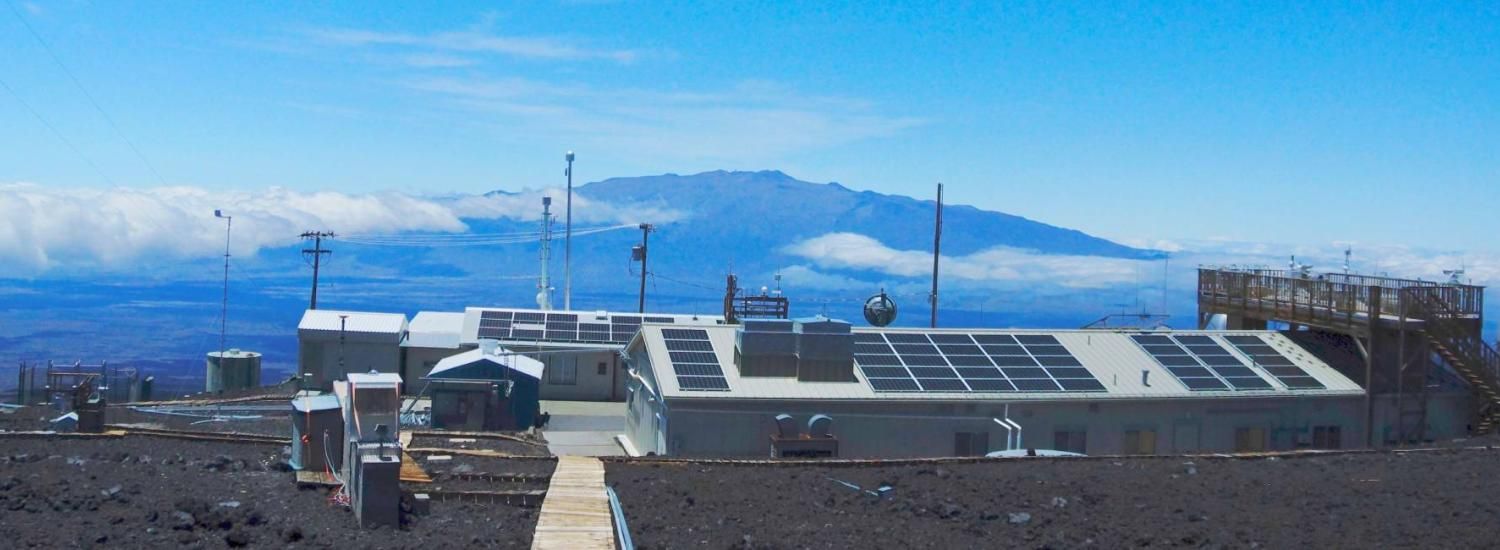
The measurements were generated by GML’s Global Greenhouse Gas Reference Network. GML makes highly accurate measurements of the three major greenhouse gases—carbon dioxide, methane, and nitrous oxide—from four baseline observatories in Hawaii, Alaska, American Samoa, and the South Pole, and from samples collected by volunteers at more than 50 other cooperative sampling sites around the world. CIRES researchers are involved at many stages, from shipping flasks around the world to air sampling and data analysis.
Measurements of methane also surged
Analysis of samples from 2020 also showed a significant jump in the atmospheric burden of methane, which is far less abundant but 28 times more potent than CO2 at trapping heat over a 100-year time frame. NOAA’s preliminary analysis showed the annual increase in atmospheric methane for 2020 was 14.7 parts per billion (ppb), which is the largest annual increase recorded since systematic measurements began in 1983. The global average burden of methane for December 2020, the last month for which data has been analyzed, was 1892.3 ppb. That would represent an increase of about 119 ppb, or 6 percent, since 2000.
In early April, GML typically releases a preliminary estimate of the global annual atmospheric increase for key greenhouse gases from January 1st in one year to January 1st in the next year. This preliminary estimate is based on measurements from weekly air samples collected at about 40 sites around the world. While GML's preliminary estimates are typically a little higher than the final calculation, which incorporates additional measurements, the 2020 increase is likely to remain one of the largest in the entire record.
Methane in the atmosphere is generated by many different sources, such as fossil fuel development and use, decay of organic matter in wetlands, and as a byproduct of ruminant digestion. Determining which specific sources are responsible for variations in methane annual increase is difficult. Preliminary analysis of carbon isotopic composition of methane in the NOAA air samples done by the Institute of Arctic and Alpine Research at the University of Colorado Boulder, indicates that it is likely that a primary driver of the increased methane burden comes from biological sources of methane such as wetlands or ruminant agriculture rather than thermogenic sources like oil and gas production and use.
"Although increased fossil emissions may not be fully responsible for the recent growth in methane levels, reducing fossil methane emissions are an important step toward mitigating climate change," said GML research chemist Ed Dlugokencky.
This story was written by NOAA Communications.