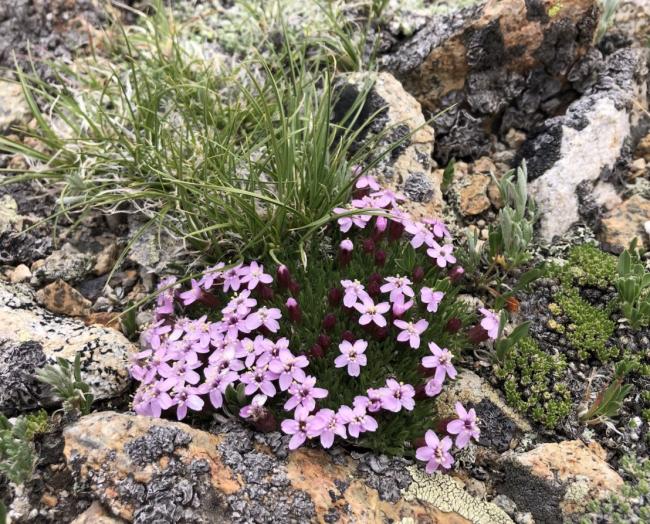
Every species on this planet thrives in a certain range of conditions (temperature, oxygen levels, moisture, etc.). As temperatures on Earth continue to warm due to climate change, scientists want to know how different species will respond to these changes--will some species be able to adapt to changing conditions where they live, or will some different geographic region become a more habitable place for them? Scientists have been keeping track of North American moss campion ‘vital rates’ over a long period of time and comparing them to observed changes in the plants’ environments. Moss campion is a hearty tundra plant that lives over a wide range of latitudes from New Mexico all the way up to Alaska. By tracking the vital rates of moss campion populations over a broad geographic area and a long time period, these scientists can try to answer questions like “How is moss campion reproduction affected by temperature?” Questions like this one can give scientists insight into how these plants might be impacted by climate changes.
Context for Use
This Data Puzzle is part of a larger collection of Data Puzzle resources that combine classroom-friendly datasets with Ambitious Science Teaching practices to help students make sense of phenomena!


Goals Header
What Students Will Do
- Students will analyze and interpret patterns of plant reproduction data for moss campion in North America in relation to temperature changes over time.
- Students will use evidence to explain how there is a tipping point for moss campion reproduction with increasing temperatures and predict how climate change could affect the stability of moss campion populations now and in the future.
Teaching Materials
Description
Day 1
Part 1 (20 minutes) Eliciting Students' Ideas
- Students engage in a whole-class discussion related to the opening scenario prompt, "Why do doctors keep track of your vital rates year after year?"
Part 2 (40 minutes) Identifying Important Science Ideas
- Students engage with an interactive reading to 1) identify similarities between the opening scenario prompt and the work of Bill Morris, Megan DeMarche, and Dan Doak, ecologists who measure the vital rates (survival, growth, reproduction) of tundra plants (e.g., moss campion), and 2) make predictions as it relates to the investigative question, "How is moss campion reproduction affected by temperature?"
Day 2
Part 3 (30 minutes) Supporting Ongoing Changes in Thinking
- Students test their prediction about the relationship between moss campion reproduction rates and temperature by analyzing temperature and reproduction data over time.
Part 4 (30 minutes) Constructing Evidence-Based Explanations
- Students reflect on evidence gathered during parts 1-3 and construct a final explanatory model for the question, "How is moss campion affected by temperature?"