This jigsaw activity introduces students with Arctic weather data using a role-playing activity that has students read and interpret graphs while considering the optimal time to plan a research mission to the Arctic.
Context for Use
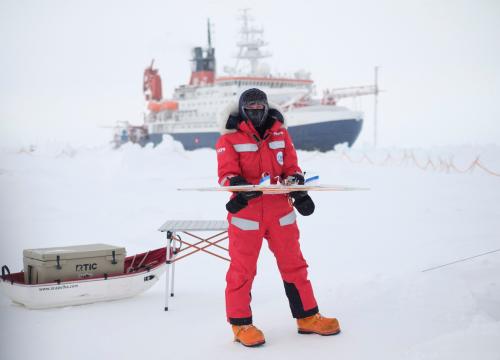
This is the second activity of a three-part curriculum about Arctic climate. The activities may be used independently or in sequence. In particular, this activity sets the stage for Activity 3 (Exploring Arctic Climate Data) in which students plot and analyze Arctic climate data. Activity 1 (Exploring the Arctic) of this sequence allows students to explore Arctic geography, then take hands-on meteorological measurements to learn about how climate data is collected in the Arctic.
- This activity was designed for high school science students. With adaptations it could be used for middle school students or introductory college students who are not science majors. It was classroom-tested for grades 5 through 12.
- Students need to have a basic understanding of how to read a line graph and how to do basic unit conversions. Students must also understand seasonal cycles of temperature, daylight, wind, and precipitation.
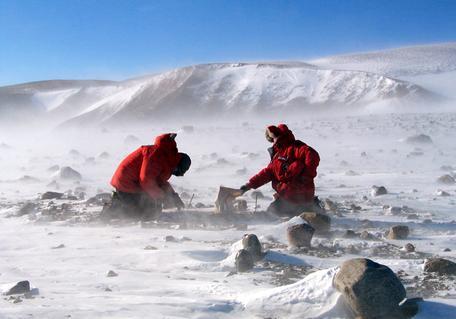
Researchers Andrew Barth, left, and Devon Brecke collect rocks near Milan Ridge in the Miller Range of the Transantarctic Mountains. A 1.4-billion-year-old chunk of granite found by John Goodge's team has proven to be a valuable piece of evidence linking Antarctica to the western United States as part of an ancient supercontinent. Photo Credit: John Goodge


Goals Header
What Students Will Do
Content/concepts goals for this activity
- Read and interpret Arctic data graphs.
- Articulate seasonal weather patterns in Arctic datasets.
Higher order thinking skills goals for this activity
- Synthesize data from four different datasets to gain a sense for the overall weather conditions throughout the year.
- Determine the optimal time to visit the Arctic, from the point of view various roles.
- Create a measurable definition for "winter."
- Compare Arctic weather to weather in their hometowns.
Other skills goals for this activity
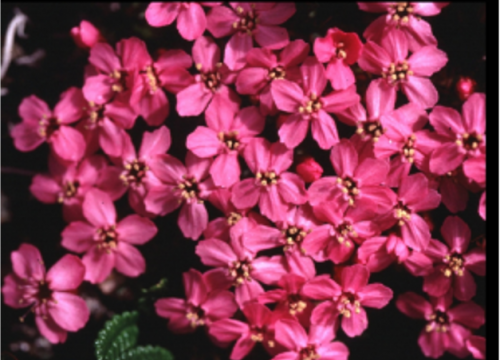
- Role playing: Students consider a collection of weather data from multiple points of view. For example, what would be the best conditions for conducting research on wildflowers, compared to observing and photographing the night sky?
Materials
Arctic Climate Curriculum Overview (Microsoft Word 2007 (.docx) 4.2MB Apr28 14) This document contains an outline of all three parts of the curriculum, describes the rationale behind curriculum development and alignment with Next Generation Science Standards and Colorado Science Standards, and contains a list of all the teaching materials that were developed for this project.
Description
This activity kicks off with a warm-up exercise in which students read the NOAA State of the Climate report to learn about the Arctic environment, then propose three questions that they might like to learn about the Arctic. This part of the activity may be assigned as homework.
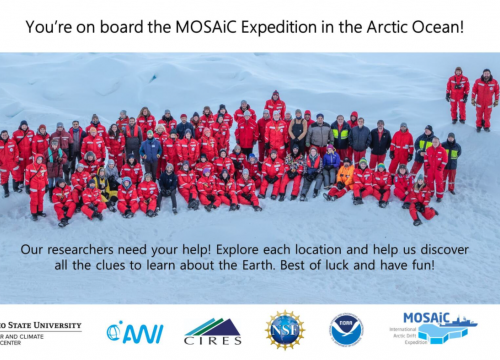
The main portion of this curriculum is a jigsaw activity that uses datasets for air temperature, wind speed, snow depth, and incoming solar radiation. Students form 'Research Groups' to learn about their assigned weather parameter and to work from a graph to describe how their parameter varies through the year.
Then the groups recombine and form 'Research Teams.' Each team is assigned a different purpose for visiting the Arctic.
Research Team 1 – Testing a fat-tired bicycle for travel across a snowy surface for field research
Research Team 2 – Collecting seeds from Arctic wildflowers
Research Team 3 – Astronomy research and photographing the night sky
Research Team 4 – Annual visit to maintain meteorological instruments at the research station.
The Research Teams consider each weather parameter to come up with a synthesis of the overall weather in Eureka, then decide when the best time for a trip would be. Because each team has a different role to play, they will come up with different answers.
Lastly, students work individually to consider whether they, personally, would want to visit the Arctic. They go on to describe how the Arctic weather, particularly the winter, differs from their own hometown.
An optional follow-on activity involves a group project to create an infographic that illustrates the weather in Eureka.