In this webinar, check back for the recording, Dr. Ted Scambos presented a 'science travelogue' for the continent of Antarctica. His nineteen expeditions to Antarctica, in every region of the continent and the sea ice that surrounds it, has made him an expert in the field.
He has studied the collapse of ice shelf areas and glacier acceleration in the Antarctic Peninsula, ice streams of the Ross Ice Shelf and wind-snow interactions on the East Antarctic Plateau, and he was part of an international scientific team that that crossed Antarctica in 2008-2009. Recent work has taken him from unique large dune features in the center of East Antarctica (“megadunes”), to the large and unstable Thwaites Glacier, to icebergs off the shore of the Antarctic Peninsula.
This webinar is part of the CIRES/NOAA Science-At-Home series.
Goals Header
About the Presenter
Dr. Ted Scambos is a Senior Research Scientist at the Earth Science and Observation Center at the University of Colorado in Boulder. He has specialized in using satellite data of the polar ice caps to map these regions in new ways, and in studying the effects of climate change in Antarctica. Among his research interests are climate change impacts on the polar regions, Antarctic history, geochemistry and planetary science.
A major focus of his work now is developing instrumentation to try to better monitor and understand Antarctic climate and ocean circulation in areas of major change.
Prior to coming to ESOC, he worked at NASA’s Goddard Space Flight Center studying Antarctica using satellite data, and he served as Lead Scientist at NSIDC for 14 years and has mentored six Ph.D. and M.S. students. He is the author or co-author of more than 140 scientific articles.
Recommended Activities for e-Learning
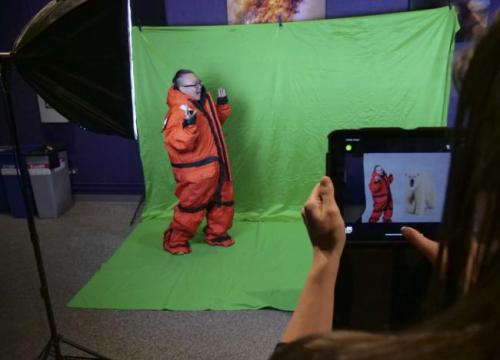
Pre-K: Polar Explorer – Pretend you’re an explorer in Antarctica, what do you see? Parents can place animals (stuffed, plastic, drawn) around the house, and ask if that animal should (or shouldn’t be in Antarctica). Use sheets, towels, and pillows to make glaciers, ice fields, caves, and moraines.
K-5: Land Ice vs. Sea Ice Model – Is there a way to see the difference in sea level rise when land ice melts versus when sea ice melts? Check out this hands-on modeling activity at the NASA’S Jet Propulsion Laboratory.
Teachers can learn how to incorporate this activity into your classroom, at CLEANet.org.
Want to take this activity even further? Make a scientific poster to share your data! Scientists present their findings at conferences with eye-catching posters. Use art supplies from your home, or design one in powerpoint.
6-8: Match the Glaciers – If you have access to a printer, you can make your own before and after cards for matching glaciers images from Windows 2 The Universe. Don’t have a printer? Head over to BrainPOP for an interactive quiz and video on Glaciers. You’ll need to create an account (which are currently free).
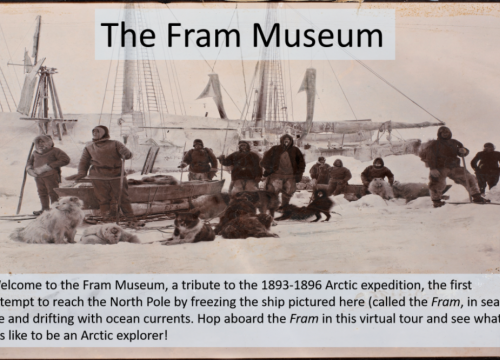
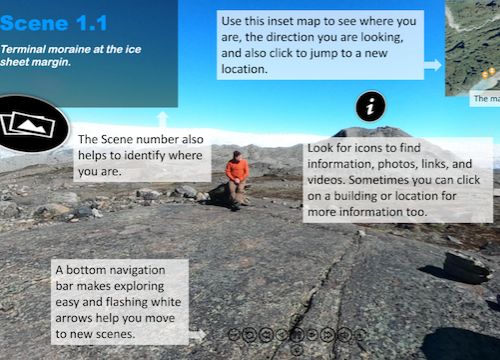
Virtual Field Trip Opportunity – Head on over to Google Earth where there are several ‘sphere images’ where you can explore the continent with scientists.
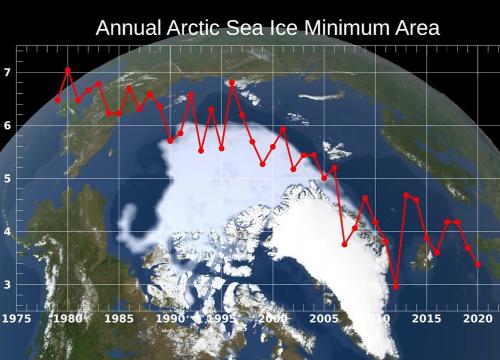
9-12: Data Science – Head on over to the Center for Remote Sensing of Ice Sheets and use real data and formulas to calculate the thickness of ice. Do you have a couple balloons? This science experiment at Fizzics Education helps explain why icebergs are frozen but the water below them isn’t. Miss math class? NSF has a 9-minute video about the math of sea ice.