Lesson Plans & Activities
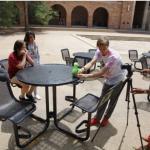
Sharing Science with Film: A Guide to Student Productions
The examples and lesson plans provided in the educator guide emphasize scientific film topics; however, the methods shared throughout Sharing Science With Film: A Guide to Student Productions are applicable to films around all topics and genres.
Sharing Science With Film: A Guide to Student Productions is a guide for educators, and provides a how-to manual for instructing youth on how to produce short films.

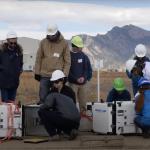
Community Resilience Expo Overview
The Expo is best taught at the end of HEART Force unit, after students are familiar with the hazard.
The Community Resilience Expo is a culminating event for the HEART Force curriculum, where students will develop and present original ideas to increase resilience in their community.
HEART Force Curriculum Overview
This unit consists of several lessons and can take anywhere from 1 to 6 weeks to teach, depending on which lesson teacher choose to incorporate.
The HEART Force curriculum builds understanding of wildfire, flood, or drought in the context of place-based community resilience.
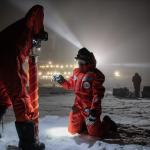
Exploring the New and Old Arctic
This unit consists of 6 lessons, each tied to NGSS nature of science understandings
In this MS/HS unit, students compare and contrast Arctic expeditions of the past (1893-1896 Fram expedition) and the present (2019-2020 MOSAiC expedition) to prepare for the Arctic of the future.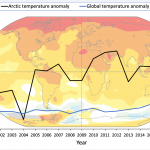
Arctic Feedbacks: Not All Warming Is Equal
This storyline unit consists of 10 lessons, each tied to NGSS Earth's systems standards
In this MS/HS unit, students engage with 360° virtual reality tours, authentic Arctic datasets, and app-based labs to construct models and explanations for the unit driving question, "Why might the Arctic be warming twice as fast as the rest of the world?"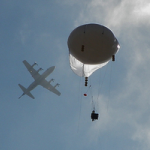
DISCOVER-AQ Curriculum Overview
The four DISCOVER-AQ modules can be completed independently, sequentially, or extended into a larger unit of study.
The DISCOVER-AQ curriculum integrates real-word research with real-life learning to answer the question: What are the causes and effects of air quality issues and how do they affect human health and the environment?

Solar Dynamics Observatory (SDO) Curriculum Overview
The SDO curriculum consists of four lessons/modules and takes 4-6 weeks to teach.
The SDO curriculum teaches students through self-directed solar explorations and encourages them to be engaged learners in order to understand the science of our Sun and to apply the knowledge they gain to solve tomorrow’s solar situations.
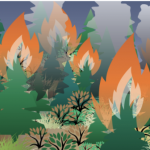
The Future of Forests
This storyline unit consists of 9 lessons, each tied to NGSS life science standards
In this middle school unit supported by NASA, students engage with online interactives, authentic datasets, and citizen science protocols to construct models and explanations for the unit driving question, "How do landscapes recover after a wildfire?"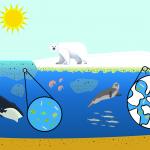
A Changing Arctic Ecosystem
This storyline unit consists of 8 lessons, each tied to NGSS life science standards
The Arctic is warming more rapidly than anywhere else on Earth. One consequence of a warming Arctic is a dramatic decline in sea ice, an important habitat for many Arctic plants and animals. In this unit students will engage with 360° virtual reality tours, hands-on labs, and authentic Arctic datasets as they gather evidence to construct explanatory models for the unit driving question, "How might the decline in sea ice affect Arctic organisms large and small?"
Geomagnetism Challenge
This lesson is centered around a data challenge using the CrowdMag application. The challenge includes live webinars, asynchronous videos, lesson plans, and the chance to win a raffle! The lessons and asynchronous videos can be used as stand-alone resources.
Individuals and classrooms are invited to join the GeoMag Data Challenge! Explore the power of community/citizen science, Earth's magnetic field, and data collection with us.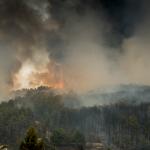
Middle School Wildfire Unit
This HEART Force curricular unit includes all lessons for the Middle School Wildfire curriculum.
The HEART Force curriculum builds an understanding of wildfire, flood, or drought in the context of place-based community resilience.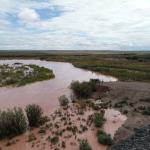
Middle School Flood Unit
This HEART Force curricular unit includes all lessons for the Middle School Flood curriculum.
The HEART Force curriculum builds an understanding of wildfire, flood, or drought in the context of place-based community resilience.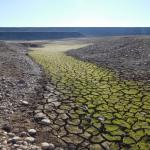
Middle School Drought Unit
This HEART Force curricular unit includes all lessons for the Middle School Drought curriculum.
The HEART Force curriculum builds an understanding of wildfire, flood, or drought in the context of place-based community resilience.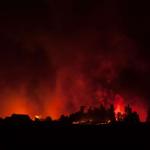
High School Wildfire Unit
This HEART Force curricular unit includes all lessons for the High School Wildfire curriculum.
The HEART Force Curriculum builds an understanding of wildfire, flood, or drought in the context of place-based community resilience.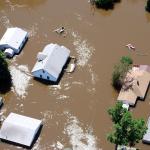
High School Flood Unit
This HEART Force curricular unit includes all lessons for the High School Flood curriculum.
The HEART Force curriculum builds an understanding of wildfire, flood, or drought in the context of place-based community resilience.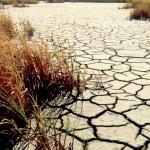
High School Drought Unit
This HEART Force curricular unit includes all lessons for the High School Drought curriculum.
The HEART Force curriculum builds an understanding of fire, flood, or drought in the context of place-based community resilience.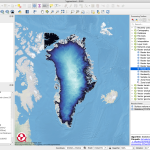
From Greenland to our Coasts: Exploring Sea Level Change with QGreenland
This unit consists of 3 lessons, each tied to NGSS life science standards
In this unit, students will explore how the Greenland Ice Sheet is changing and why that affects coastal communities worldwide. Students will view authentic Greenland geospatial data and learn how to create flood maps to assess local risk in QGIS.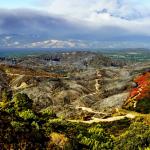
Lake County Cascading Hazards Unit
The unit has four lessons in total.
This unit builds an understanding of five natural hazards and their connections in the context of place-based community resilience.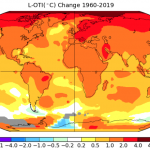
Data Puzzle: On a Budget
This data puzzle is a stand-alone lesson that is part of a larger collection of data puzzles.
The Arctic is currently warming at a rate faster than the global average, a phenomenon known as Arctic amplification. In this Data Puzzle, students analyze authentic Arctic datasets to construct explanatory models for the following question, "Why might the Arctic be warming faster than other places on Earth?"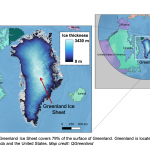
Data Puzzle: Balancing Act
This data puzzle is a stand-alone lesson that is part of a larger collection of data puzzles.
Since the early 2000s, the Greenland Ice Sheet’s mass balance has been consistently negative, meaning more mass is being lost than gained. But this change in mass balance hasn’t always happened at the same rate. What could account for observed changes to the amount of ice in the Greenland Ice Sheet in recent decades?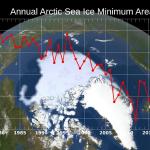
Data Puzzle: To Reflect or Not to Reflect
This data puzzle is a stand-alone lesson that is part of a larger collection of data puzzles.
The color of Earth's surface determines how much of the Sun's energy is reflected or absorbed, where lighter-colored surfaces are more reflective (higher albedo). In this Data Puzzle, students analyze authentic Arctic data to construct explanatory models for the following question, "How might the Arctic’s albedo be affected by the observed decline in sea ice?"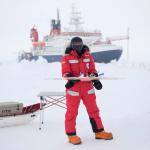
Data Puzzle: It's All Connected
This data puzzle is a stand-alone lesson that is part of a larger collection of data puzzles.
What makes the Arctic climate system so unique is the sea ice, which influences the Arctic climate in many ways. In this Data Puzzle, students analyze authentic Arctic data to construct explanatory models for the following question, "What effect, if any, do leads (cracks in the sea ice) have on the transfer of moisture between the Arctic Ocean and atmosphere?"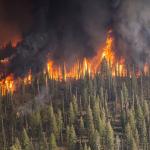
Data Puzzle: Megafire - Rare Occurrences or the New Normal?
This data puzzle is a stand-alone lesson that is part of a larger collection of data puzzles.
Megafires have been a hot topic in the news over the past few years, but are they a new phenomenon? In this Data Puzzle, students analyze authentic wildfire data to construct explanatory models for the follow question, "How and why has the number of megafires have changed over time?"
Data Puzzle: Megadrought in the Colorado River Basin
This data puzzle is a stand-alone lesson that is part of a larger collection of data puzzles.
Much of the western United States is experiencing drought conditions. In this Data Puzzle, students analyze authentic climate data to construct explanatory models for the following question, "What is causing the megadrought in the Colorado River Basin?"
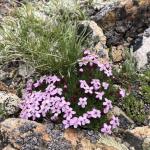
Data Puzzle: What's the Limit?
This data puzzle is a stand-alone lesson that is part of a larger collection of data puzzles.
Moss campion is a hearty flowering plant that thrives in harsh arctic and alpine tundra ecosystems over a wide range of latitudes in North America. In this Data Puzzle, students analyze authentic moss campion growth and survival data to construct explanatory models for the following question, "How is the growth and survival of moss campion affected by latitude?"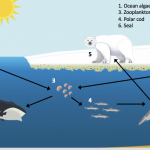
Data Puzzle: Tracing Carbon Through the Arctic Food Web
This data puzzle is a stand-alone lesson that is part of a larger collection of data puzzles.
The Arctic is home to a huge variety of living things (humans included) that have adapted to harsh conditions. However, these conditions are changing as Arctic temperatures rise and sea ice declines. In this Data Puzzle, students trace the flow of carbon through the Arctic food web to construct explanatory models for the following question, "How might the decline in sea ice affect Arctic organisms large and small?"
Data Puzzle: The Tipping Point
This data puzzle is a stand-alone lesson that is part of a larger collection of data puzzles.
Plants like moss campion are uniquely adapted to the cold, dry climate characteristic of the tundra biome...but temperatures are on the rise. In this Data Puzzle, students analyze temperature and reproduction data to construct explanatory models for the following question "How is moss campion reproduction affected by temperature?"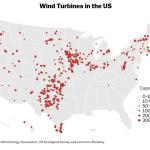
Data Puzzle: Wind Farms of the Future
This data puzzle is a stand-alone lesson that is part of a larger collection of data puzzles.
Transitioning from fossil fuels to clean, renewable energy sources like wind is essential if the US is to reduce its carbon emissions. But where should new wind farms be constructed? In this Data Puzzle, students analyze surface roughness and wind speed data to construct an evidence-based explanation for the following question, "Where in the United States (lands and waters) should new wind turbines be constructed to generate the most energy?"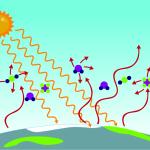
Data Puzzle: Not All Warming is Equal
This data puzzle is a stand-alone lesson that is part of a larger collection of data puzzles.
The dramatic increase in atmospheric carbon dioxide has caused global temperatures to rise by more than 1.1°C (~2°F), but not all warming is equal. In this Data Puzzle, students analyze temperature and atmospheric carbon dioxide datasets to construct explanatory models for the following question, "Do the places on Earth where temperatures are increasing the most also have the greatest increases in atmospheric carbon dioxide?"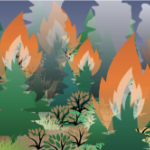
Data Puzzle: Wildfire, Drought, and the Future of Forests
This data puzzle is a stand-alone lesson that is part of a larger collection of data puzzles.
Wildfires are burning more and more of the forests across the western United States. In this Data Puzzle, Data Puzzle, students analyze post-fire forest recovery datasets as they gather evidence to construct explanatory models for the following question, "How do climate conditions impact the recovery of forests after a wildfire?"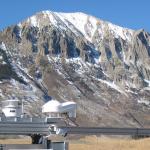
Data Puzzle: Snow in the Rockies
Water from snowmelt high in the Rocky Mountains feeds into the Colorado River, a river system that more than 40 million people rely on for water. In this Data Puzzle, students analyze snowfall and snowmelt datasets to investigate the question, "How have snow conditions in the East River Watershed changed over time?"